Natural gas is being touted as a ‘bridge fuel’ from CO2-intensive coal to renewable energy. But is natural gas really a bridge — or a gangplank — to the future? Currently, the U.S. is plunging headlong into natural gas, but is this smart?
In a nutshell, the story this report tells is:
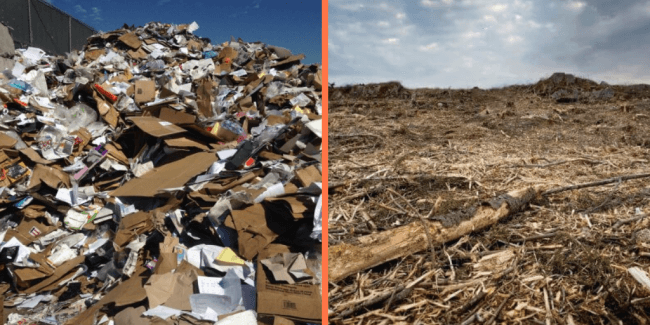
- Coal is being displaced by natural gas, while solar, wind and efficiency still provide a small fraction of electricity
- Utilities have a financial interest in promoting natural gas and undermining clean energy
- Clean energy is cheaper and far less risky than natural gas over the long term; largely unreported story is that U.S. natural gas supplies are likely overstated by at least 50%, and well decline rates are very high at 70-90% over the first three years
- Natural gas (methane) warms the atmosphere 86 times more than CO2 over 20 years
- Methane leakage is a serious issue, and leakage rates are likely 5-6%, far more than the 1.5% industry and the U.S. EPA are reporting
- Ratepayers bear the real responsibility of paying for bad decisions
Coal Displaced by Natural Gas; Solar, Wind Provide Small Percentage of U.S. Electricity
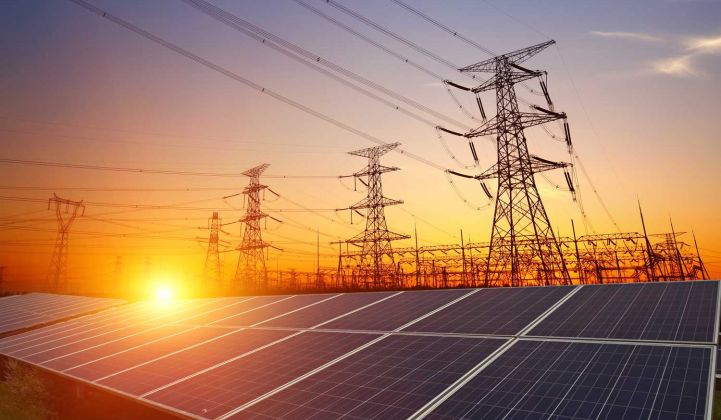
Between 2000 and 2015, over 284,000 MW of natural gas power plants were added to the U.S. grid, accounting for 70% of the total capacity of all power generation (see below).[1] In comparison, the U.S. has 515,470 total MW of natural gas power plants, 85,000 MW of wind,[2] and 56,000 MW of solar capacity (~2% of total electricity generated).[3]
An enormous amount of gas plants have been added to the grid in a short time, and while solar and wind are gaining, natural gas generates far more electricity (32%)[4] than solar (~2%)[5] or wind (7%)[6]. And during the past few years, electric utilities have increasingly merged with natural gas companies, and are building their own natural gas pipelines.[7]
Utilities Have Financial Interest In Promoting Natural Gas, Undermining Clean Energy
Why are electric utilities, which for decades have purchased natural gas fuel from pipeline companies, now buying gas pipelines and building power plants? The reason is simple: utilities earn more on pipelines (~14%) than on power plants and power lines (8-10%).[8]
Unfortunately for the public, both the federal and state regulatory agencies[9] are widely acknowledged ‘revolving doors’,[10] as former regulators go to work for the natural gas industry, electric utilities, or work as lobbyists and attorneys.[11]
Arizona is an example of how corrupt public utilities commissions and the utilities they regulate have become. Despite the fact that Arizona has some of the best sun in the world, its largest utility spent nearly $11 million in early to mid 2018 to kill a ballot initiative that would require the state to be at 50% clean energy by 2030, an easily achieved goal that will actually save money.[12]
The same utility, Arizona Public Service, has spent $4 to $10 million each election cycle to elect utility-friendly regulators, governors and attorney generals.[13] Arizona is currently just 6% solar, and 30-40% coal, despite 3-4 cents/kWh solar contracts.[14] Florida is even worse, at less than 0.65% solar, 68% natural gas, and the rest coal.[15]
Clean Energy Is Cheaper and Far Less Risky Than Natural Gas Over the Long Term
The Rocky Mountain Institute (RMI) estimated that under four test-case scenarios, clean energy resources would cost 8-60% less than the natural gas power plants over the same time frame, and that even a modest carbon tax of $8/ton or cost-effective large-scale community solar would make clean energy cheaper.[16]
RMI found that about half of U.S. power plants will need to retire by 2030, and that if utilities replace this generation with natural gas, it will require a $500 billion investment in power plants, plus another estimated $400-500 billion for natural gas fuel.[17] Current utility resource plans call for adding 110,000 MW of natural gas[18] by 2030 at a total cost of $112 billion.[19]
Shale Gas Supplies: Overstated, No Third Party Verification
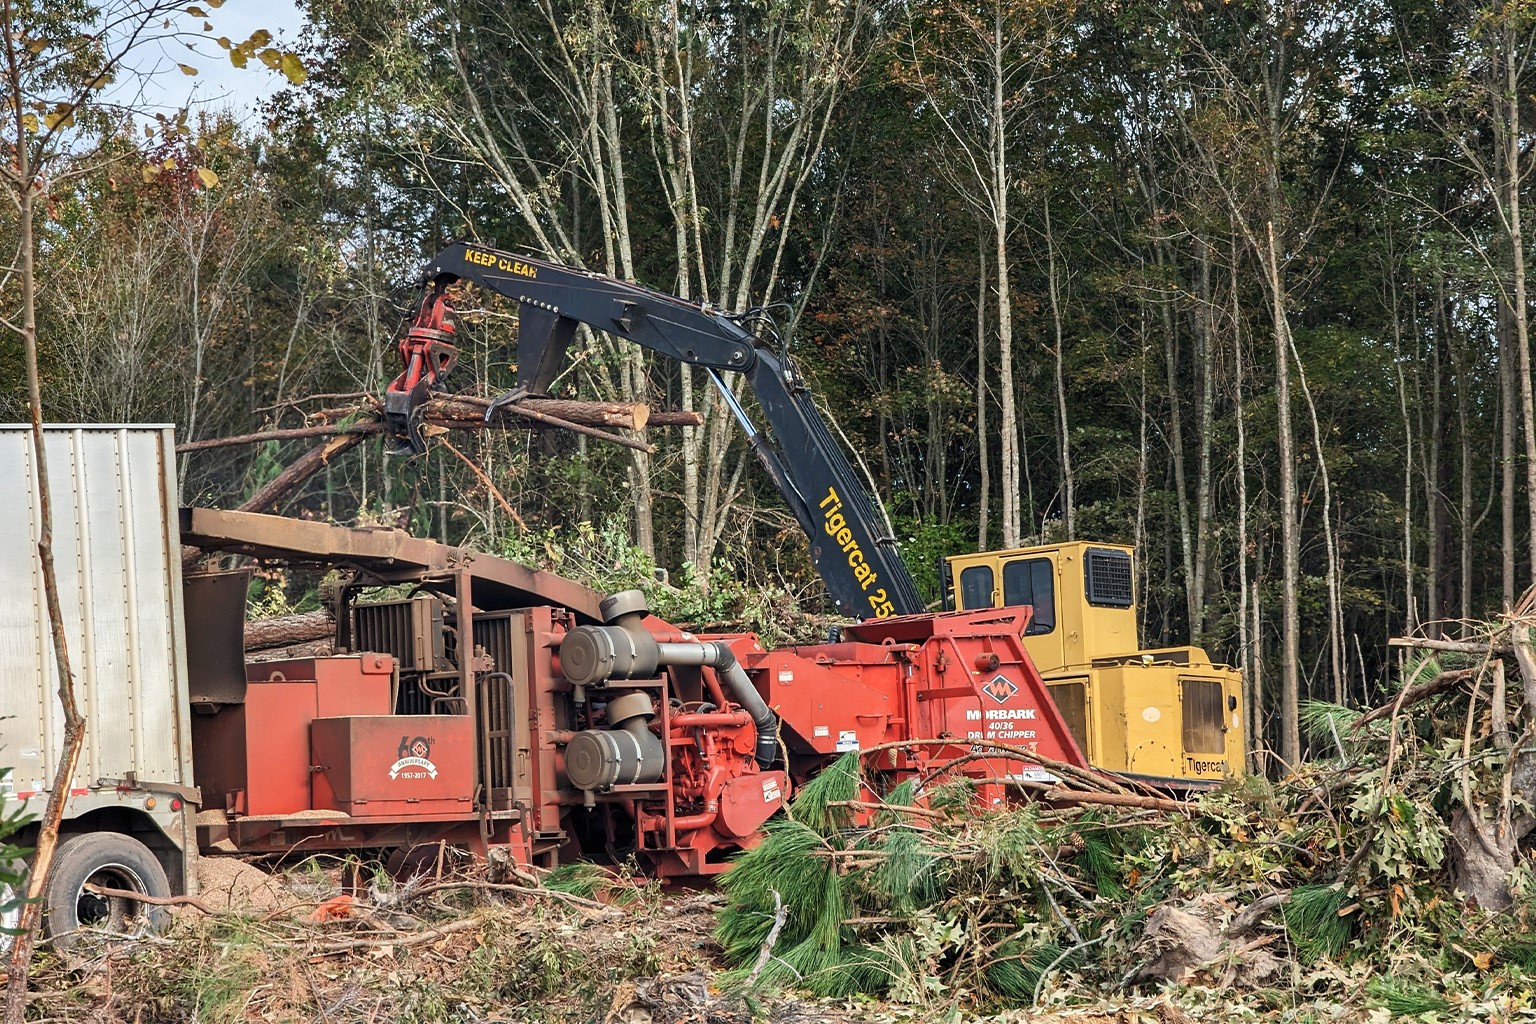
In addition, credible experts report that the shale gas industry (commonly known as ‘fracking’) is a Ponzi scheme, with very high well decline rates of 70-90.[20] Shale gas expert David Hughes has demonstrated this with shale gas plays such as the Haynesville down by nearly half five years after peaking.[21] Hughes and oil and gas expert Art Berman believe that future shale gas reserves are overestimated between 50% and 100%.[22] As the ‘sweet spots’ that produce most of the gas are drilled and quickly decline in production, there are fewer places left to drill.
The deception goes even deeper, with the U.S. Securities and Exchange Commission (SEC) in 2011 refusing to adopt a common-sense requirement that shale gas companies get third party verification of reserve estimates. The New York Times reported that after the SEC declined the need for verification, many shale companies immediately increased the amount of reserves, some by as much as 200%. A stock trader who refused to push Enron stocks as far back as 1998 said of the rule change by the SEC, “Welcome back to Alice in Wonderland.”[23]
Since 2007, Shale Gas Industry Has Lost $280 Billion
Since 2007, the shale gas industry has lost a staggering $280 billion — more money than it’s made — and yet Wall Street continues to loan the industry billions. Why? Because the fees Wall Street has generated for itself are enormous, as fees are paid whether the shale play generates profit or is a loser. As the Houston Chronicle noted in a headline, “Even in bankruptcy, oil bosses are promised riches.”[24] Noted geologist Art Berman has said that without cheap credit,[25] the shale boom would never have happened.[26]
Natural Gas Is Displacing Clean Energy Such as Wind, Solar and Energy Efficiency
Although utilities promote natural gas as a climate-friendly replacement for coal,[27] the reality is that natural gas power plants are displacing truly clean energy such as solar, wind, energy efficiency, geothermal and other non-fossil-fuel energy resources. And while utilities argue that natural gas will save the developing world from energy poverty, United Nations officials point out that natural gas is driving climate change, which in turn is creating more poverty.[28]
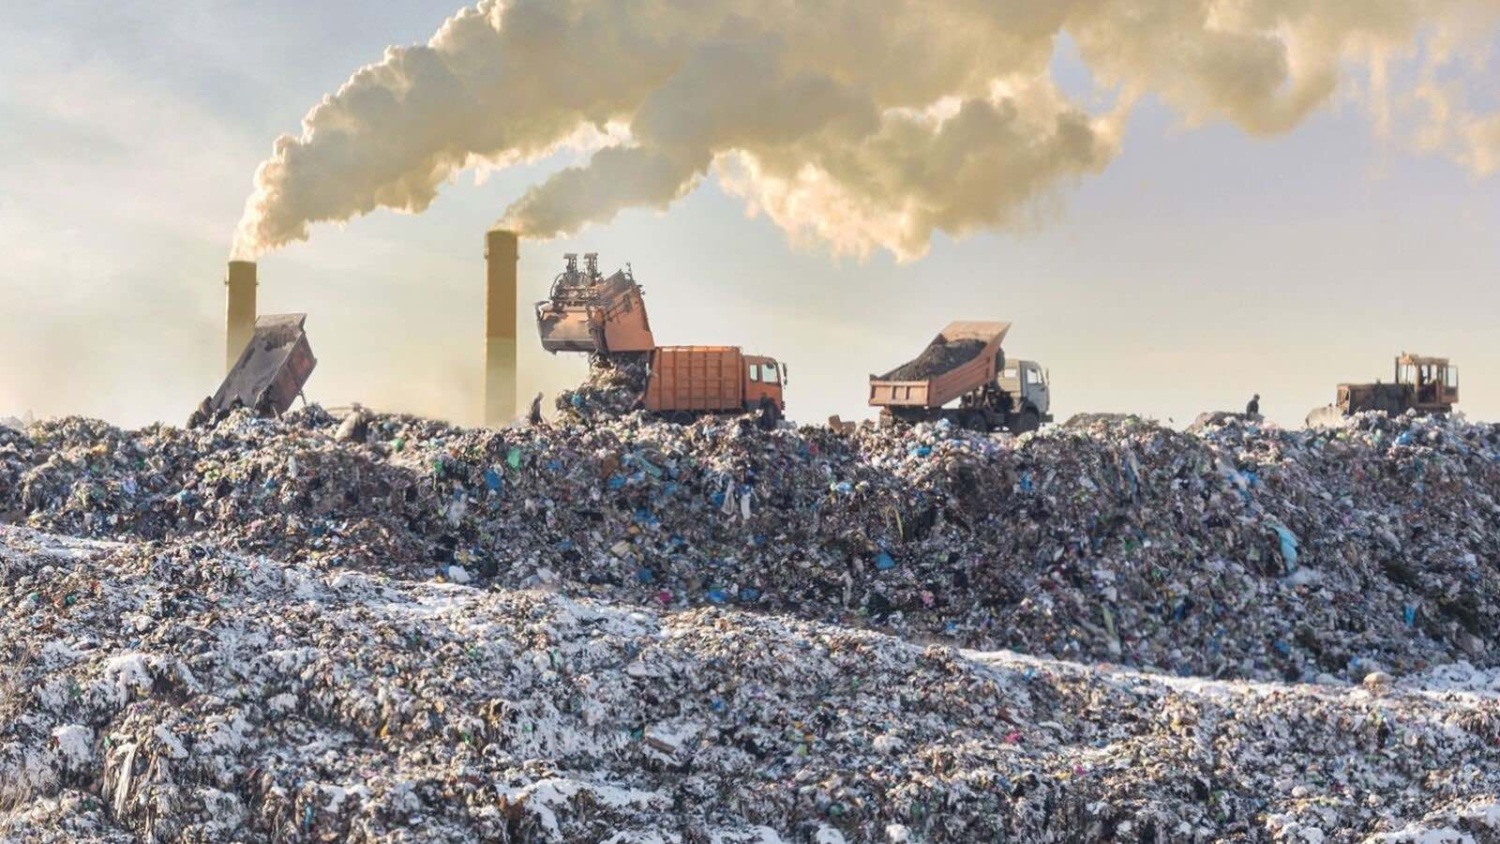
A 2011 study released by Harvard University determined that the externalized costs of coal fired electricity are at least 17.8 cents/kWh, and could be as high as 27 cents/kWh, when damages from extraction, transportation, processing and combustion are taken into account. These damages could total over $523 billion per year.[29]
Utilities have known for decades that burning coal damaged the climate,[30] and surely must understand,[31] via hundreds of studies and filings by clean energy advocates, that natural gas is worse for the climate than coal. The only ignorance utilities can assert is willful, and willfully ignoring credible evidence is not a defense.
Natural Gas: A Bridge to Clean Energy, or a Gangplank to Climate Chaos?
Is natural gas (70-90% methane) actually a “bridge fuel” that emits only half the CO2 of coal when burned, or is it a gangplank to climate chaos? Natural gas is a “super-greenhouse” gas, generating 86 times (86x) more warming than CO2 over twenty years.[32] This multiplier (86x) is from the Intergovernmental Panel on Climate Change’s (IPCC’s) 5th Assessment, released in 2014.[33]
The New York Times (NYT) has made progress on recognizing that methane’s effect on the climate is far worse than CO2. In 2014, the NYT reported that natural gas (methane or CH4) is 30 times times (30x) worse than carbon dioxide (CO2),[34] but in March 2018, reported that methane is a “shorter-lived but far harder-hitting gas that could cause faster bursts of warming.”[35] A few months later, in June 2018, the NYT finally reported that methane “could be 80 times worse than CO2” for the climate over 20 years.[36]
Noted climate scientist Dr. Drew Shindell of Duke University reports that the Global Warming Potential (GWp) for methane is even higher, at 105x, rather than 86x, when the effects of gas-aerosol interactions are taken into account.[37] [38]
Methane leakage, which occurs during the production, transportation and distribution of natural gas in pipelines, also adds to the problem.
Methane Leakage is Likely 5-6%, Not 1.5 – 2.3% Promoted by Industry and EPA
Methane’s high potency as a greenhouse gas is juiced up even more by its high leakage rate, which occurs during the life-cycle of natural gas production.[39] EPA and industry state that methane leakage is only 1.5%, while other studies show much higher leakage rates of 5-6% and even 10% or higher.[40]
After over a decade of methane leakage studies, more researchers are agreeing with Dr. Robert Howarth’s 2011 estimate that shale gas leakage rates are 3.9% for conventional gas, and 5.8% for fracked gas.[41] A ‘study of studies’ that reviewed 200 papers on methane leakage found a mean methane leakage rate of 5.4% — very close to Howarth’s 5.8%.[42]
Ten Year Mystery Solved: Source of Methane Emissions
For the past ten years, scientists have tried to determine where the rapid yearly increases in methane emissions came from, and which sector(s) — the oil and gas industry, microbial production (rice paddies and marshes), or fires — accounted for what percentage of the increase?
Atmospheric concentrations of methane (CH4) rose from 1,770 parts per billion (ppb) in the early 2000s, to the current 1,850 ppb. Determining CH4 sources is far more complex than determining CO2 sources, requiring a ‘detective job’ using multiple types of evidence, including chemical and isotopic signatures. This increase in methane concentrations is an important factor, along with the high leakage rate, in speeding up climate change.
In December 2017, a NASA study determined that 68% (or 17 Teragram or Tg) of the 25 Tg/year increase in methane emissions were from oil and gas development,[43] while only 48% (12 Tg) came from wetlands/rice farming; while methane released from fires actually declined by 16% per year (4 Tg).
The U.S. likely plays an outsized role in the rapid increase of global methane emissions. A 2016 Harvard study concluded that the U.S. alone could be responsible for 30-60% of the global growth in human-caused methane emissions since 2002,[44] and thus it is critical to reduce methane as quickly as possible.
Dr. Robert Howarth’s research shows that burning natural gas (methane) for electricity, whether from fracking or from conventionally drilled wells, is far worse for the climate than burning coal – with fracked gas, currently over 60% of total U.S. natural gas — over twice as bad.[45]
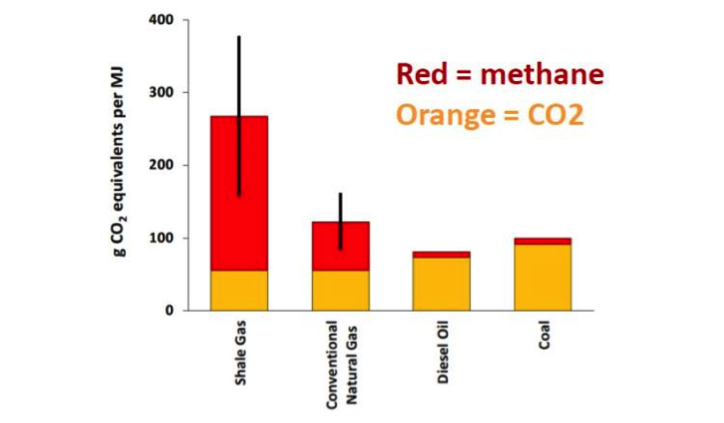
Using the correct metrics — 86x rather than 34x for methane’s warming effect, and a 5-6% leakage rate rather than 1.5% — is critical. As coal power plants are rapidly retired, we must not replace coal with natural gas, but with clean energy. Increasing natural gas electricity will increase, not decrease, our chances of rapidly increasing global temperatures.
Utilities Won’t Acknowledge: Natural Gas Fueling Climate Change
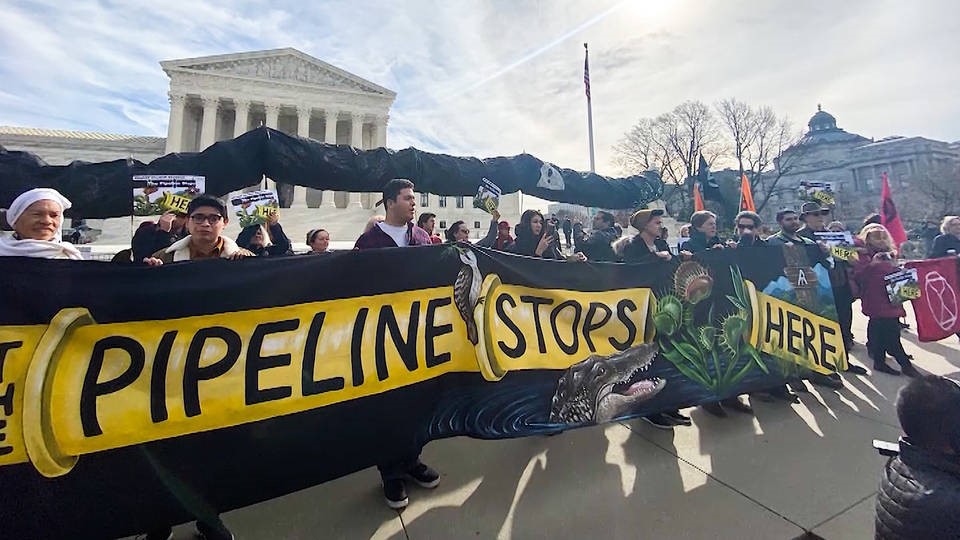
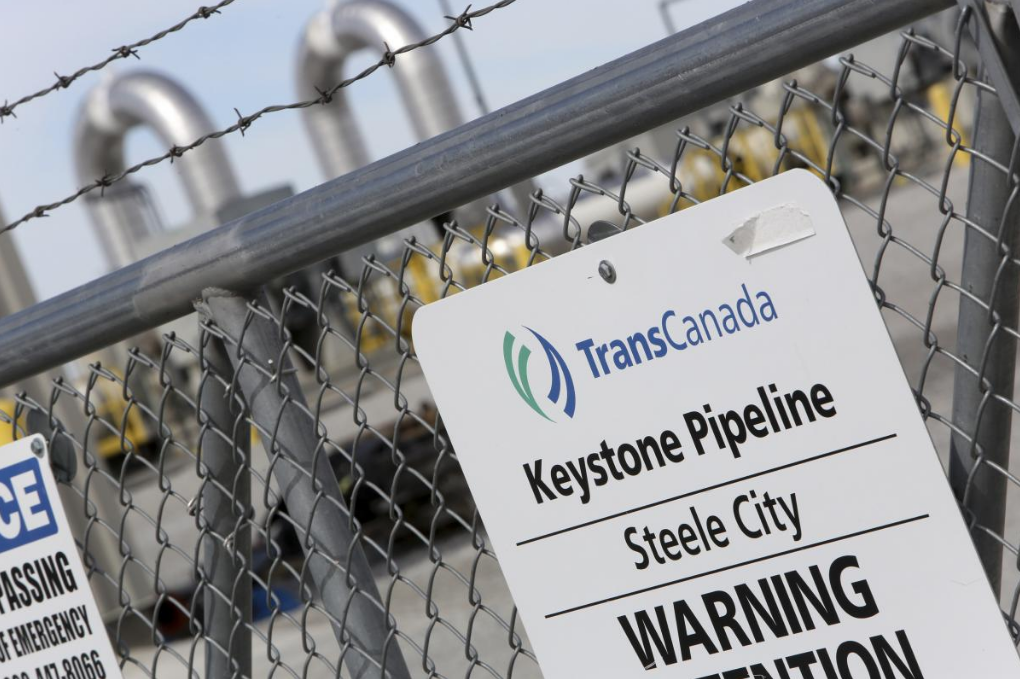
Utilities are reluctant to recognize that natural gas is fueling climate chaos, as $32 billion worth of natural gas pipelines have been built or are in development, along with $112 billion spent on natural gas power plants.[46] These gas plants and pipelines are expected to last 30 years in order to be cost effective.
With the weakening of antitrust laws, utilities can now own both the natural gas pipeline that delivers the gas, as well as the power plant that burns the gas.[47] Thus, utilities make money from the sale of electricity, as well as a return on billions spent on new gas pipelines, and additional revenue for moving the gas through the pipeline.[48] Utilities have little incentive to invest in clean energy like wind or solar when they make far more profit on natural gas power plants (~10%) and pipelines (~14%).
Unfortunately, natural gas is crowding out solar, wind, solar thermal and other cost-effective and non-polluting technologies that we should be investing in heavily. Natural gas power plants and pipelines that are not used for the expected lifespan of 30 years could become stranded assets if either natural gas fuel is not available, or the fuel is so expensive that running these plants is cost-prohibitive — in addition to enormous damage to the climate and public health and wildlife populations.
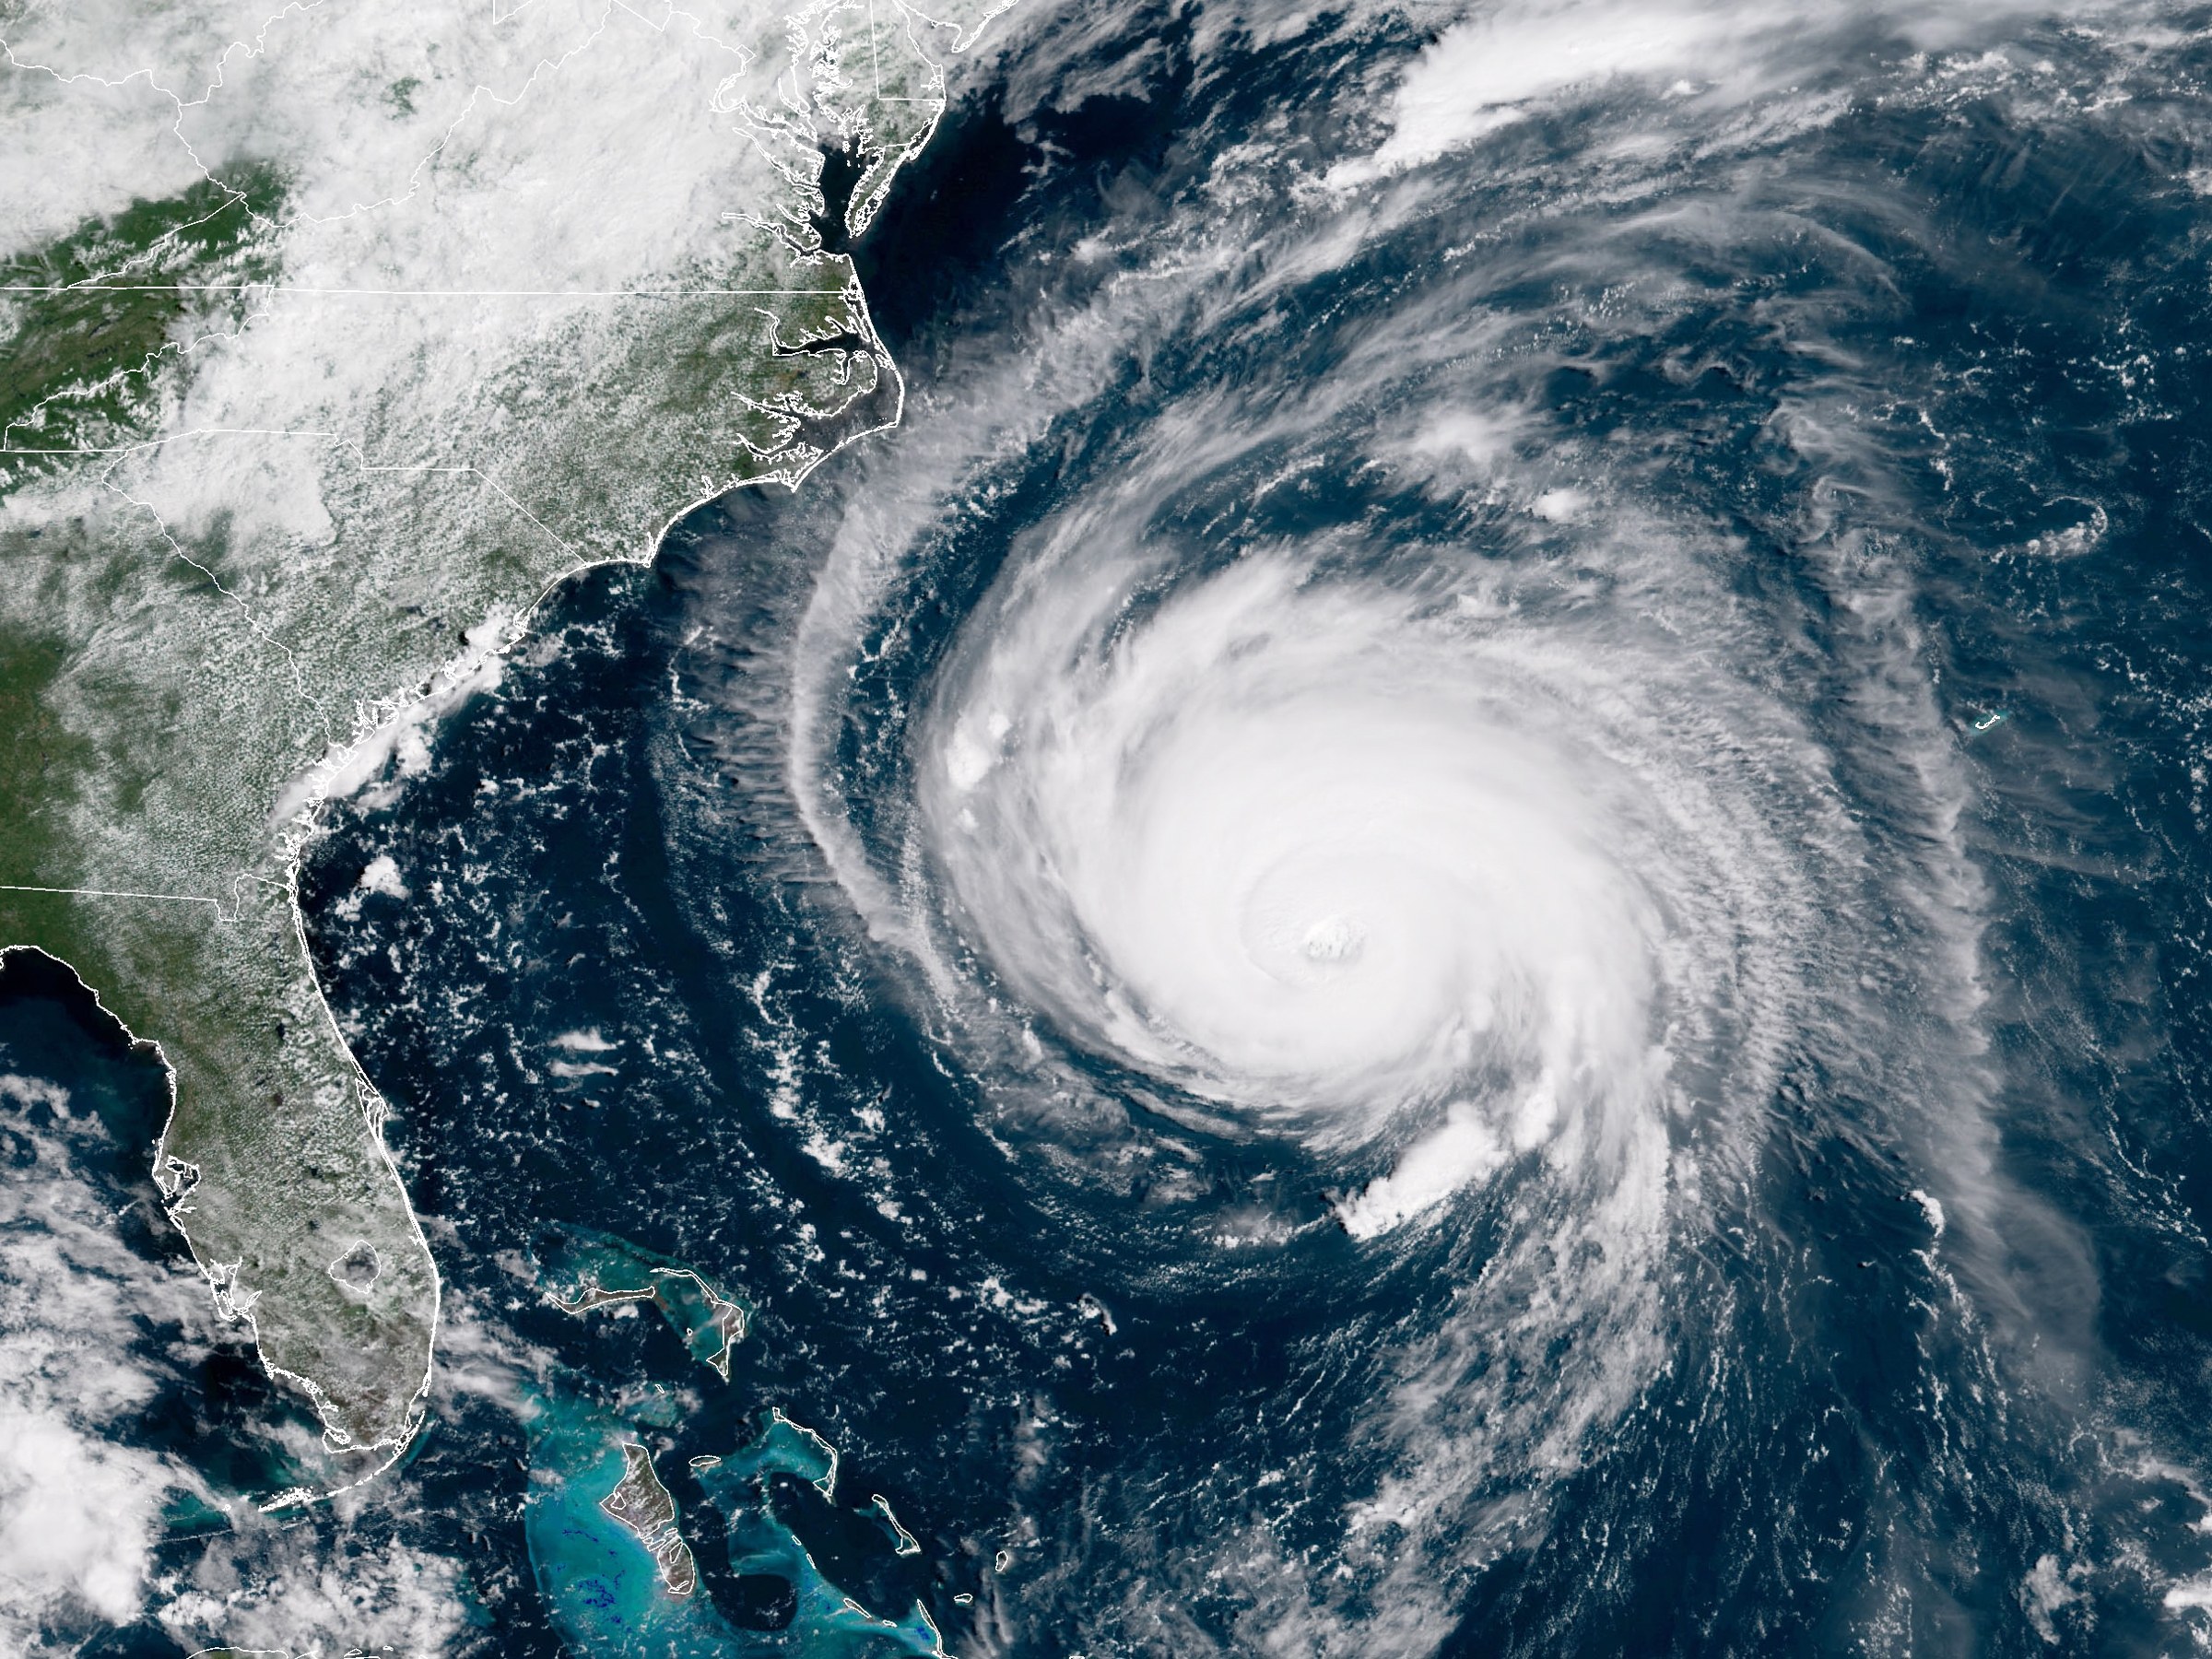
Climate change will play out as climate chaos, bringing more destructive hurricanes, more wildfires, rising oceans that flood coastal cities, loss of glacial water supplies, and other serious, long-term effects.
Clean Energy: Zero Fuel Costs, No Toxic Waste, No Water Use
In addition, the cost of natural gas has been extremely volatile since 2000 (see below), and ratepayers, not utilities, are responsible for paying fuel costs. Recognizing the potential for natural gas fuel costs to rapidly increase greatly increases the risk for ratepayers, who must pay for the cost of natural gas, no matter how much natural gas costs. Utilities do not pay for fuel.
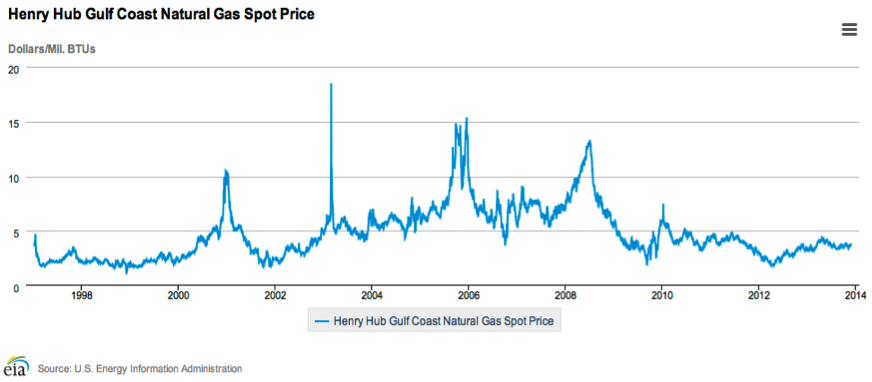
Henry Hub Gulf Coast Natural Gas Spot Prices – 1995 to 2014
Fracked gas now comprises two thirds of all U.S. natural gas production[49]; and fracked wells have very high decline rates of 70-80% over the first three years.[50] The U.S. utility industry is putting all its eggs in the natural gas basket. Even sunny states like Arizona, which is only 6% solar, utility plans over the next decade or so add at least 6,000 MW of new gas plants, and only 300-500 of utility-scale solar over the next decade.[51]
Fuel cost and availability is a large risk for ratepayers — not utilities. Fuel is more than half of the total cost to run a natural gas power plant, and if price spikes that happened post-Katrina, when natural gas shot up to $13/MMBtu are repeated, (current price is ~$2.73/MMBtu Henry Hub), the cost of electricity could double or triple overnight.
This has, in fact, happened many times during the past few winters in the Northeast, when “polar vortex” weather caused a huge spike in demand for electricity. During the 2014 polar vortex, wind energy saved $1 billion over two days in the northeast.[52]
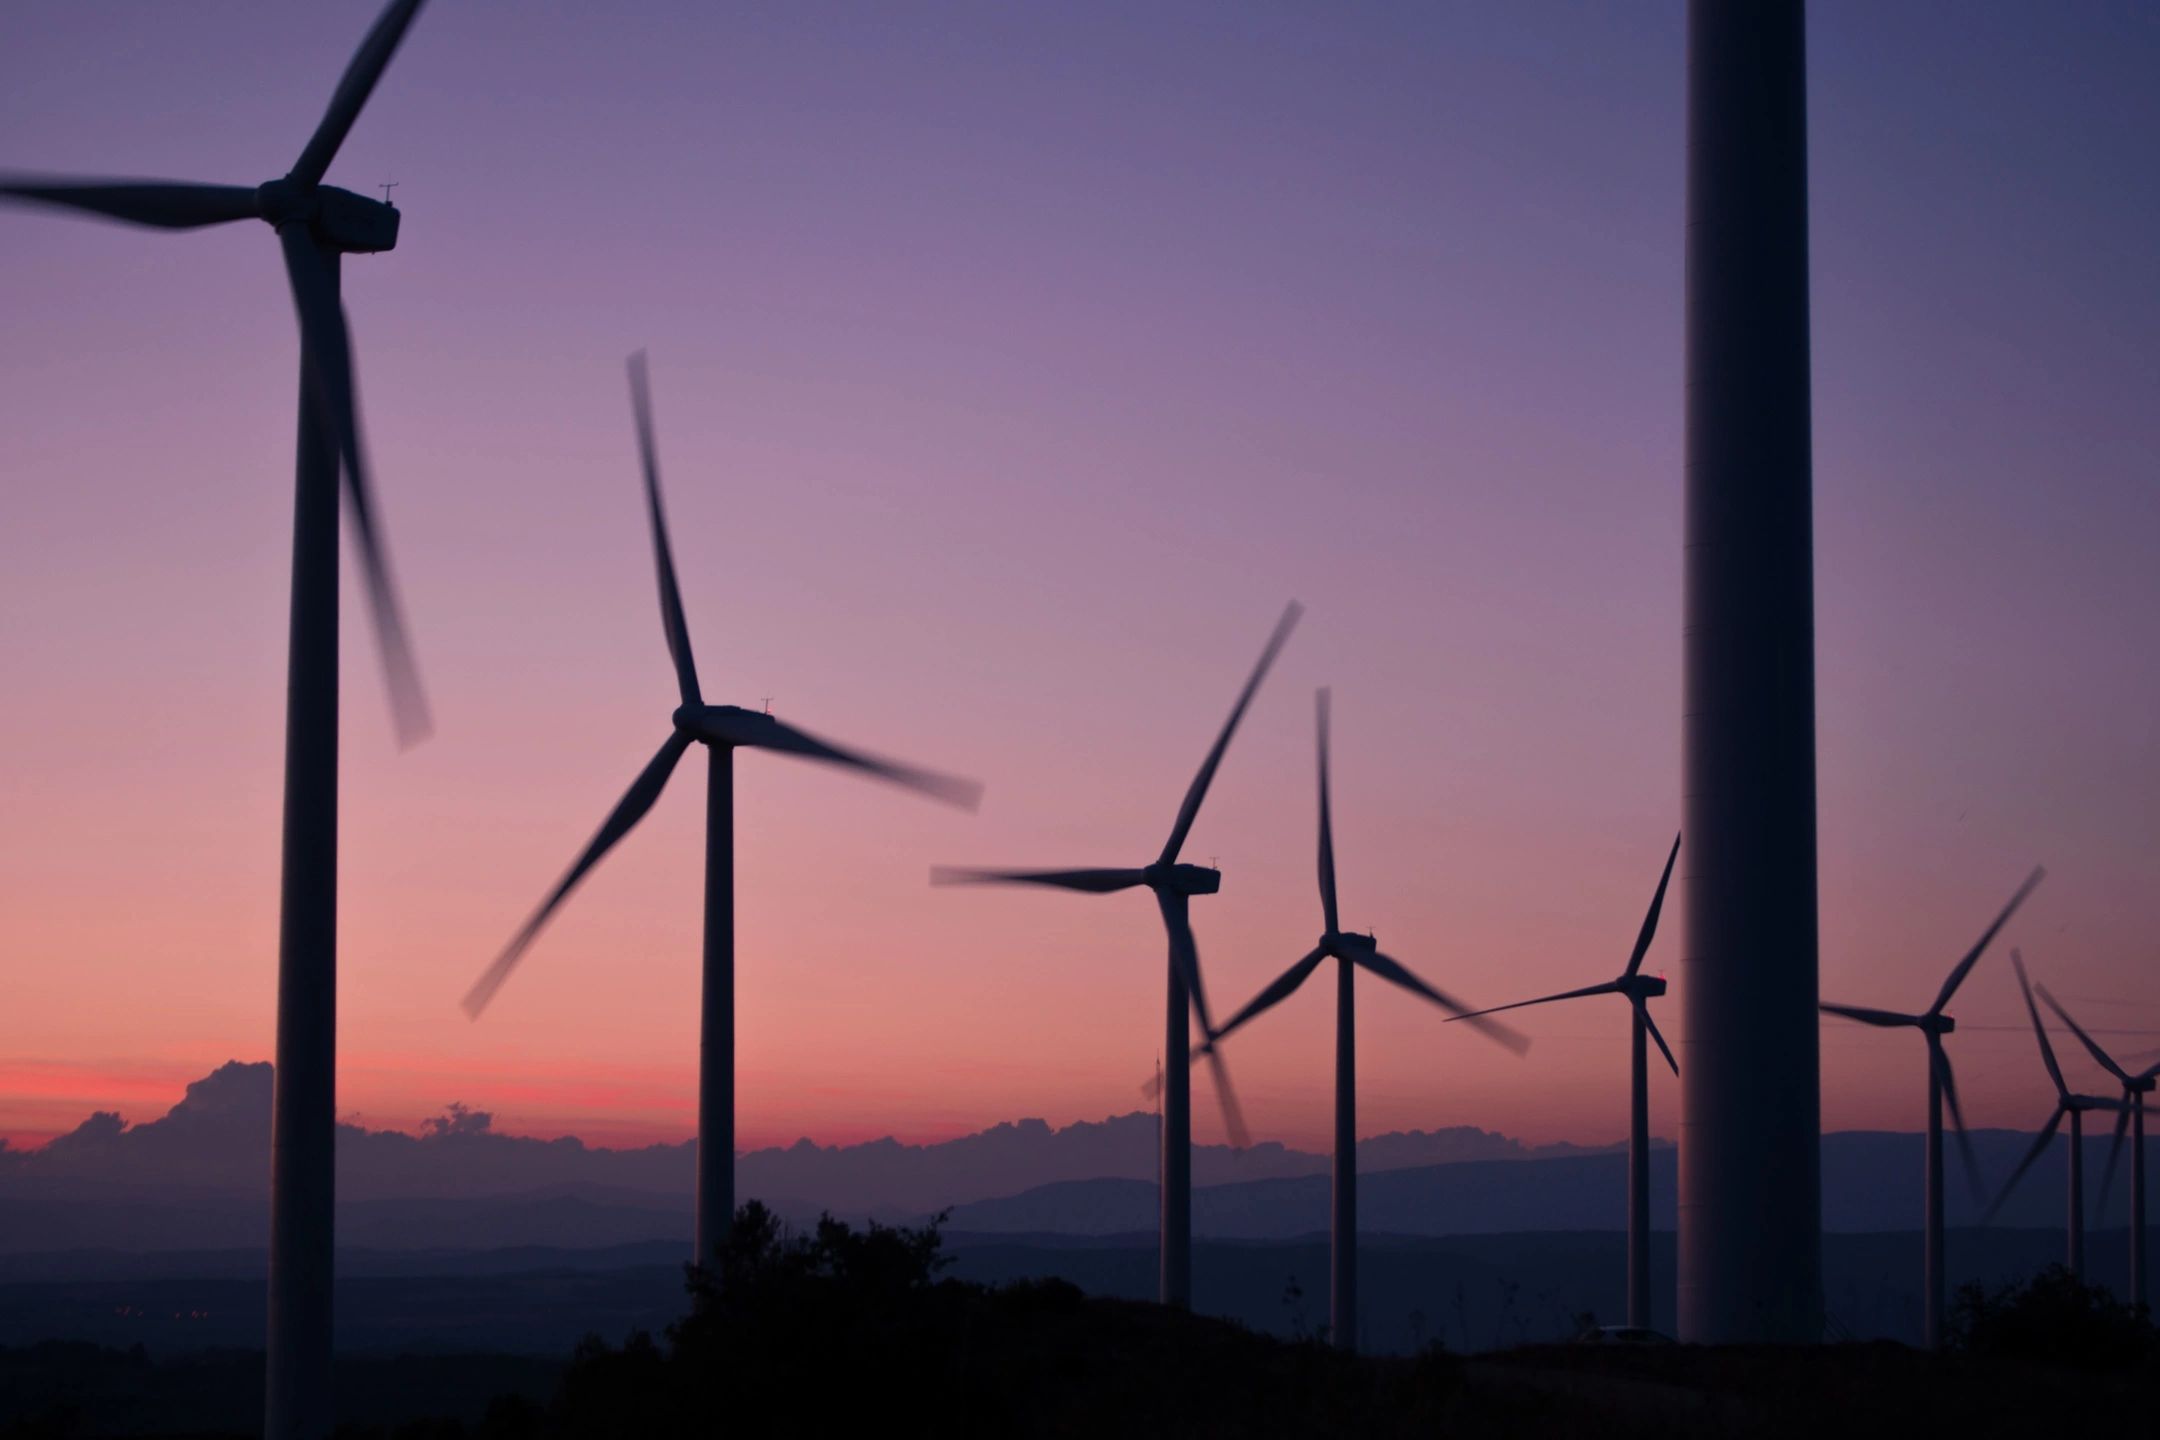
Costs of Clean Energy Are Very Low, and Continue to Drop
Thousands of articles have been written about the precipitous fall in the cost of clean energy. A few numbers tell the story: a contract to purchase solar electricity in Arizona at the stunning cost of 2.5 cents/kWh was signed in early summer 2018, only to be eclipsed a few weeks later by an even lower cost contract in Nevada for 2.4 cents/kWh.[53]
Solar hot water has barely scratched the surface,[54] and could even provide grid storage, as almost half of the hot water heaters in the U.S. use electricity (rather than natural gas).[55]
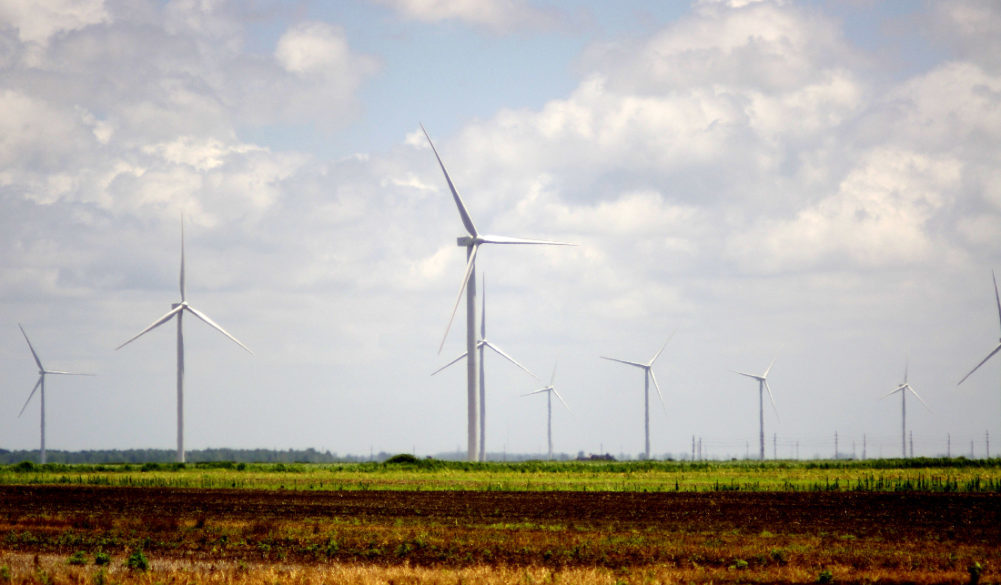
Wind power is even cheaper than solar, costing about 2 cents/kWh on average in the U.S., even as the amount of electricity generated by each wind turbine continues to increase. Wind supplies more than 10% of total electricity generation in 14 states, and 29% to 37% in three states (Iowa, South Dakota and Kansas). [56]
Energy efficiency is another extremely cheap resource that has hardly been utilized in many U.S. states, particularly the southeast.[57]
Despite the fact that clean energy costs have plummeted, even as the technology continues to improve, most utilities push for bail-outs for fossil fuel plants that are now more expensive than clean energy. A recent study showed that it could cost $16-$35 billion per year to prop up dirty power plants that are no longer cost-effective relative to clean energy.[58]
North Carolina’s Electricity Mix and Policy Landscape
North Carolina’s (NC’s) electricity mix in 2016[59] was 30% natural gas, 28.6% coal and 32.5% nuclear. The rest was mostly hydropower and biomass, with solar generating about 2% of electricity in 2016, and 4.64% of electricity currently.[60] The total solar investment in NC is $6.5 billion.
Duke Energy is currently less than 2% clean electricity in North Carolina.[61] Duke Energy’s North Carolina 2017 Integrated Resource Plan (IRP), which looks ahead 15 years ahead, estimates that by 2032 only 7% of its electricity generation will be from solar and wind, plus 3% from energy efficiency. Duke Energy as a whole – in 6 states – is currently at only 1% solar.[62]
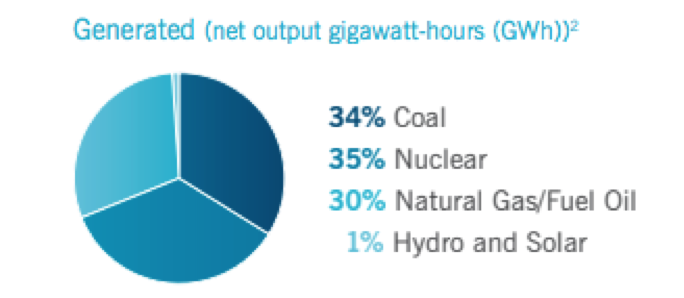
Duke Energy At A Glance – 2017 Annual Report
All States (FL, IN, KY, NC, OH, SC)
Although NC is currently 2nd in the U.S. in total installed solar capacity, the solar market is virtually all wholesale, where solar electricity that’s generated in-state is sold to utilities or to very large users of electricity such as ‘server farms.’ NC has very few solar rooftops — less than 8,000 — in large part because ‘third party’ solar is not allowed.[63] This means that individuals who want solar must either purchase the entire system upfront, or must take out a loan. Although these solar leases are legal, it adds a layer of complexity that has made it difficult for the residential solar market to thrive.
In 2016, the North Carolina General Assembly ended a 35% state tax credit for solar installations, which also caused the residential market to crash.[64] Although NC spent hundreds of millions on state tax credits, the return to state and local tax coffers was $1.50 for every $1.00 spent, so that each dollar spent was a net increase in income for state and local governments.[65]
In 2016, NC spent $1.13 billion importing coal, and $1.11 billion importing natural gas to run electric power plants.[66]
CONCLUSION
It’s critical that our elected officials, media, regulators and utilities recognize that the fracking boom has been fueled by a huge increase in natural gas fired power plants. These power plants, in turn, drive demand for more natural gas pipelines. Natural gas’s effect on climate is far worse than coal fired electricity. The rapid increase in natural gas puts our communities at risk for rapidly increasing climate change, as well as the potential for natural gas fuel shortages. Leakage from the natural gas production cycle is greatly underestimated, and is making a difficult situation worse.
The cost of clean energy is now less than dirty energy, even without including ‘externalities’ such as mercury poisoning, asthma, heart attacks, mountaintop removal (blowing up mountains to get at the coal) and other damages.
It’s imperative that governors, state attorneys general, state and federal regulators as well as utilities push for more transparency and risk analysis when approving permits and rate hikes for fossil fuel power plants and pipelines, particularly fracked gas. State level regulators must open up proceedings to allow greater participation of both the public and experts, and must require utilities to be more transparent. After all, utilities in regulated states are virtually guaranteed hefty profits of 10% — or more — and in exchange, must prove that they are acting in the public’s best interest.
[1] https://www.utilitydive.com/news/eyes-wide-open-despite-climate-risks-utilities-bet-big-on-natural-gas/426869/
[2] https://www.awea.org/wind-energy-facts-at-a-glance
[3] https://www.seia.org/solar-industry-research-data
[4] https://www.eia.gov/energyexplained/index.php?page=electricity_in_the_united_states In 2017, EIA’s U.S. electricity mix: 32% gas, 30% coal, 20% nuclear, 7.5% hydro, 6.3% wind, 1.3% solar.
[5] https://www.seia.org/solar-industry-research-data
[6] https://www.awea.org/wind-energy-facts-at-a-glance
[7] https://www.utilitydive.com/news/high-returns-on-new-pipelines-spur-unnecessary-capacity-report-argues/505609/
[8] https://insideclimatenews.org/news/02082017/natural-gas-pipeline-boom-corporate-profit-bubble-limited-demand-climate-emissions
[9] https://www.e-education.psu.edu/ebf483/node/683
[10] https://onlinelibrary.wiley.com/doi/pdf/10.1111/j.1748-5991.2011.01119.x
[11] https://www.utilitysecrets.org/ddc-advocacy-eei-we-stand-for-energy/
[12] https://eu.azcentral.com/story/news/politics/elections/2018/07/17/clean-energy-healthy-arizona-ballot-measure-targeted-big-aps-spending-arizonans-affordable-energy/793040002/
[13] https://eu.azcentral.com/story/opinion/op-ed/laurieroberts/2018/07/05/arizona-corporation-commission-finds-conflict-arizona-public-service/761726002/
[14] https://www.seia.org/state-solar-policy/arizona-solar
[15] https://www.eia.gov/state/?sid=FL and https://www.seia.org/state-solar-policy/florida-solar
[16] https://www.rmi.org/news/report-release-the-economics-of-clean-energy-portfolios/
[17] https://www.rmi.org/news/report-release-the-economics-of-clean-energy-portfolios/
[18] 110,000 MW of a total current natural gas power plant capacity of 515,500, see fn 1.
[19] https://www.rmi.org/wp-content/uploads/2018/06/RMI_Clean_Energy_Portfolios_2018.pdf
[20] www.ncwarn.org/methane-events, see David Hughes PPT and testimony.
[21] http://www.ncwarn.org/methane-events/ See David Hughes PPT and testimony.
[22] http://www.postcarbon.org/wp-content/uploads/2018/02/Hughes_Shale-Reality-Check_Winter-2018.pdf
[23] https://www.nytimes.com/2011/06/27/us/27gasside.html
[24] https://www.desmogblog.com/2018/05/29/flip-well-fracking-shale-halcon-resources-floyd-wilson
[25] http://www.artberman.com/shale-gas-not-revolution/
[26] https://www.forbes.com/sites/arthurberman/2017/07/05/shale-gas-is-not-a-revolution/#33c809a631b5
[27] https://www.bloomberg.com/news/articles/2018-06-28/natural-gas-pushed-as-a-fossil-fuel-answer-to-global-warming
[28] https://www.bloomberg.com/news/articles/2018-06-28/natural-gas-pushed-as-a-fossil-fuel-answer-to-global-warming
[29] https://thinkprogress.org/life-cycle-study-accounting-for-total-harm-from-coal-would-add-close-to-17-8-kwh-of-electricity-6e2ca8efc44a/
[30] https://www.huffingtonpost.com/entry/the-utilities-knew-exxon-knew-shell-knew-they-all_us_598aee87e4b030f0e267c8a8
[31] http://www.ncwarn.org/methane-events/ In NC, www.ncwarn.org repeatedly filed testimony in various dockets from natural gas experts David Hughes, Dr. Robert Howarth, and Touche Howard on the risks, high decline rates, high leakage rates, and overstated reserves of natural gas, but the testimony was struck regulators at the request of Duke Energy Carolinas/Duke Energy Progress. As a result, these issues were never reviewed.
[32] https://www.epa.gov/ghgemissions/understanding-global-warming-potentials
[33] https://www.epa.gov/ghgemissions/understanding-global-warming-potentials
[34] https://www.nytimes.com/2014/02/14/us/study-finds-methane-leaks-negate-climate-benefits-of-natural-gas.html
[35] https://www.washingtonpost.com/news/energy-environment/wp/2018/03/19/the-arctics-carbon-bomb-might-be-even-more-potent-than-we-thought/?utm_term=.c9461be2548b
[36] https://www.nytimes.com/2018/06/21/climate/methane-leaks.html
[37] http://science.sciencemag.org/content/326/5953/716.full
[38] Charlotte, North Carolina, is using an even lower number for methane’s climate-warming potential: 25x. Personal communication with J. Donald Keen.
[39] https://thinkprogress.org/how-the-epa-and-new-york-times-are-getting-methane-all-wrong-eba3397ce9e5/
[40] http://www.climatecentral.org/news/limiting-methane-leaks-critical-to-gas-climate-benefits-16020
[41] http://www.eeb.cornell.edu/howarth/publications/Howarth_2014_ESE_methane_emissions.pdf
[42] https://thinkprogress.org/by-the-time-natural-gas-has-a-net-climate-benefit-youll-likely-be-dead-and-the-climate-ruined-22fd00f89e73#.fg6z8djyl
[43] Total global methane emissions are ~550 teragrams/year https://www.earth.com/news/methane-emissions-measured-reported/
[44] https://www.theguardian.com/environment/2016/feb/17/us-likely-culprit-of-global-spike-in-methane-emissions-over-last-decade
[45] http://www.rosalux.eu/topics/social-ecological-transformation/methane-emissions/
[46] https://www.rmi.org/wp-content/uploads/2018/06/RMI_Clean_Energy_Portfolios_2018.pdf
[47] https://www.citizen.org/our-work/climate-and-energy/puhca-repeal-dummies-sequel
[48] https://www.utilitydive.com/news/high-returns-on-new-pipelines-spur-unnecessary-capacity-report-argues/505609/
[49] https://www.eia.gov/todayinenergy/detail.php?id=26112
[50] https://www.resilience.org/stories/2018-04-03/the-problem-with-eia-shale-gas-and-tight-oil-forecasts/
[51] https://www.energyandpolicy.org/aps-renewable-energy-ballot-measure-gas/
[52] https://www.triplepundit.com/2015/01/wind-power-polar-vortexes-price-gouging/
[53] http://ieefa.org/ieefa-update-unmistakable-trends-in-american-wind-and-solar/
[54] https://www.greentechmedia.com/articles/read/stat-of-the-day-the-enormous-potential-of-the-other-solar-solar-hot-water
[55] https://www.utilitydive.com/news/utilities-in-hot-water-realizing-the-benefits-of-grid-integrated-water-hea/445241/
[56] http://newscenter.lbl.gov/2017/08/08/annual-wind-power-report-confirms-technology-advancements-improved-project-performance-low-wind-energy-prices/
[57] http://aceee.org/state-policy/scorecard
[58] https://www.awea.org/BrattleBailoutCosts
[59] https://www.eia.gov/state/print.php?sid=NC
[60] https://www.seia.org/state-solar-policy/north-carolina-solar
[61] http://www.ncwarn.org/2017/10/watchdogs-to-duke-ceo/
[62] https://www.duke-energy.com/annual-report/_/media/pdfs/our-company/investors/de-annual-reports/2017/2017annualreport.pdf, page 12
[63] http://www.dsireusa.org/resources/detailed-summary-maps/
[64] https://www.newsobserver.com/opinion/opn-columns-blogs/ned-barnett/article38700429.html
[65] https://www.greenstatepower.com/ncsea-nc-report/
[66] https://www.eia.gov/state/seds/data.php?incfile=/state/seds/sep_sum/html/sum_ex_eu.html&sid=US
Nancy LaPlaca, J.D. is a regulatory and energy expert who served as Policy Advisor to Arizona Corporation Commissioner Paul Newman. She served as co-chair on the Energy Resources and the Environment Subcommittee of the National Association of Regulatory Utility Commissioners, and is a member of the National Renewable Energy Lab’s Solar Access to Public Capital group, which is working to streamline clean energy financing. Her expertise includes energy efficiency, home energy auditing, demand response, transmission, net metering, rate design, the water-energy nexus, and power plant externalities. Nancy has worked for two Arizona congresspeople, as a management and technology consultant, and in state and federal government. Nancy plays guitar and piano, composes songs. and has a fine arts and a law degree from Arizona State University.